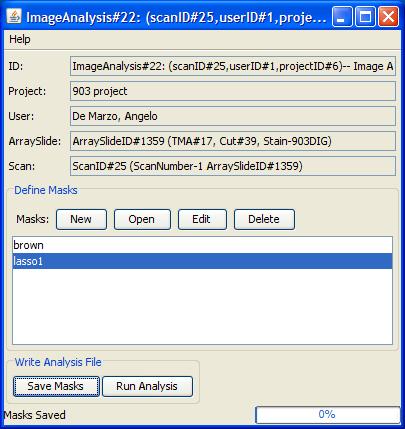
The main image analysis window
is shown to the right. In the image analysis application,
different types of "masks" can be created for an image.
Masks
Color Masks
Color masks are also known as pixel threshold masks. To add a new
Color Mask, Right
Click in the Masks box and select New.
In the Add Mask bar, name this some sort of descriptive
term
such as “Brown”
or “Blue” and select Color Mask.
In the color mask, you will simply set an HSB (HSV- Hue, Saturation,
Brightness) color range for the mask. To begin identifying the color of
interest, click the Open… button to open 1 or more images. Use the Hand
Button to select a pixel in the image that you want for that Mask.
Every time you select a pixel using the "hand" tool, the range will be
expanded to include this pixel and all pixels between it and the
previously selected range. All pixels in the range will be highlighted
in RED. A threshold can also be expanded by moving the Min/Max
Hue, Sat and Bri slides to include additional space. You cannot change
the values by typing new values into the number boxes.
Lasso Masks
Lasso masks are also known as freehand masks. To add a new Lasso
Mask, Right
Click in the Masks box and select New.
In the Add Mask bar, name this some sort of descriptive
term
such as “Glands”
or “Removed,” and select Lasso Mask.
Click a navigation button (one of the arrows) to begin cycling through
all of your images. Drawa lasso around any region of
interest. If you have two or more regions of interest, hold down
the shift key. If you do not hold down the shift key, each new
lasso will replace the old lasso. Click the Close Button when you are
finished. The Default if no Lasso Choice controls what is
recorded in this mask if the user fails to draw a lasso for a certain
image. Setting it to nothing excludes everything on the image if the
user doesn't circle a lasso. Since this step usually takes the
longest in the program, you may want to save the project
periodically.
Image Tools
Zoom Button: The Zoom button lets you zoom in (left mouse click) or
zoom out (right mouse click) on an area of interest. It is a good idea
to zoom in on the images to the point that the image appears pixilated
to identify individual pixels to select.
Mask Box : This toggles the mask you have created. Uncheck this
box if you wish to see the original image (If this is unchecked, the
pixels in the mask won't be highlighted.) Toggling on/off can be
performed for each Mask that has been generated. The Color of the
Mask and the Order relative to other Masks can also be changed by left
clicking on the value.
Meta Masks
A Meta Mask is a logic statement that allows for the combination of
information in already defined masks. Meta masks are also called
"masks of masks". To generate a Meta Mask, right click in the
Masks box, select New and name the Mask based on what function it will
serve and select Meta Mask. Then right click on the Meta Mask and
click Configure. Press the Add line to generate statements.
Example: Let's say you created a Color Mask called BROWN, and you
created a Lasso Mask which you called CIRCLED_CANCER_AREA. You only
wanted to see the area that was both BROWN AND in the
CIRCLED_CANCER_AREA. And means Logical And. If you choose "And",
the Meta-Mask will identify only regions that are in BOTH of the
selected Masks . If you use Logical Or, the meta-mask will
include regions that are in both thetwo selected Masks. For this
example, You would add a Meta Mask that has:
[ -----] [WHAT IS IN] BROWN
[AND] [WHAT IS IN] CIRCLED_CANCER_AREA
If you had accidently selected OR, your meta-mask would include areas
that are both in the brown area and in the circled cancer area, as
opposed to the area where they both intersect (and).
Meta Masks can include a number of previously made Color, Lasso or
other Meta Masks. The logic options are AND/OR and what is
in/what is NOT in.
Close the Meta Mask window after you are complete. You are then ready
to use this mask.
|
|
The main Image Analysis
Window
|
|