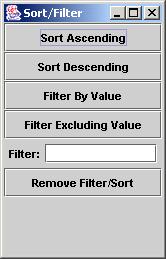
Data Panel


The data panel allows users to filter what images in an ArraySlide are seen, as well as customize the order in which they appear.


To access the data panel, the user clicks the Data button in the Array Slide Panel.

ArraySlide Panel


The data panel is displayed and shows information about every image in the arraySlide.   


Data Panel: Information about each spot (x and y coordinate) is displayed in a tabular format
screenshot


Right clicking on the table displays the Sort Filter Panel.


Sort Filter Panel
screenshot
Sort Filter Panel Options
Sort Ascending
Sort values in the clicked column in increasing order
Sort Descending
Sort values in the clicked column in decreasing order
Filter By Value
View only rows in which the clicked column has the same value clicked cell.
Filter Excluding Value
View only rows in which the clicked column has a different value than the clicked cell.
Filter
View only rows in which the clicked column has the same value as the user-entered value
Remove Filter/Sort
Restore all rows, in their original order


Lets say we click on a table cell value that says "normal prostatic epithelium", and then click "Filter By Value".  Only the rows that have "normal prostatic epithelium" will be displayed.  Next we hit the "Apply" button, and our array slide highlights in red all the rows that are "normal prostatic epithelium".

ArraySlide Panel: A filter has been applied to the ArraySlidePanel highlighting relevant images in red.


Now, when the "Next" or "Back" buttons is clicked on the ArrayImage panel, we will only see images that have been classified as "normal prostatic epithelium".


Customizing the Order of the Images

The data panel allows the user to control the order in which the images appear when the user clicks the "Next" and "Back" buttons.  Normally, the user will view the images from left-to-right and then top-to-bottom.  However by using the "Sort Ascending" or "Sort Descending" button in the Sort/Filter Frame (displayed when the user right clicks on the data panel), the user could order the images by any displayed column.

For example,the images could be ordered by a "Percent Positive" score. The image with the lowest "Percent Positive" score would be viewed first, then the next highest, and so on (Assuming the user clicked "Sort Ascending".  The reverse would be true if the user clicked "Sort Descending").


Back to Documentation of Image Analysis Application

© Copyright 2009 | All Rights Reserved | The Johns Hopkins University